Feature guide 2/12 · Updated November 14, 2026
Screen layout and menus
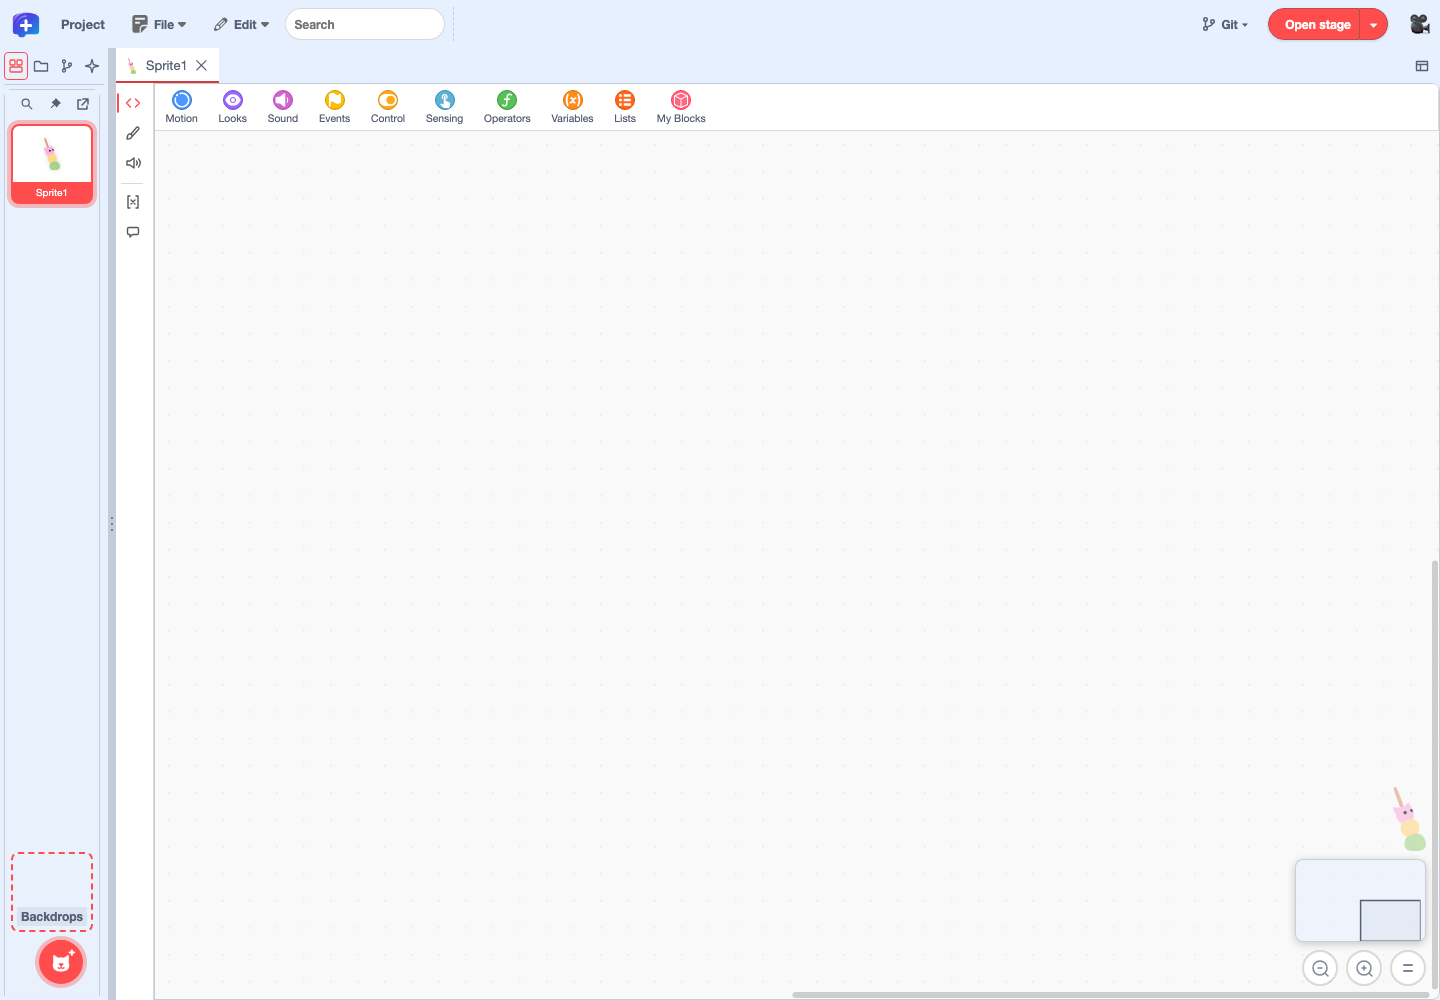
In the menu bar at the very top, project operations are grouped in the "File" and "Edit" menus, and the stage, Git, recording, debugging and extension controls are gathered on the right.
2.1 The menu bar
The top row of the screen has these elements, from left to right.
| Position | Element | What it does |
|---|---|---|
| Far left | TurboWarp Plus logo | Opens the TurboWarp Plus menu |
| Left | Project title field (initially "Project") | Renames the project |
| Left | "File ▾" and "Edit ▾" | Project operations and editing operations |
| Center | "Search" field | Search and replace across the whole project |
| Right | "Git ▾" (shows the branch name once a repository is chosen, for example "main ▾") | "Choose Repository…", "Open Local Git", and switching branches |
| Right | "Open stage" and "▾" | Open the stage and choose where it opens |
| Right | 🎥 (Record) | Records the stage. While recording, the state, such as a countdown or "Stop recording", appears beside it |
| Right | "…" (Debugger) | Opens the debugger |
| Far right | Extension button area | Extension settings and controls |
Below the menu bar, at the left edge of the screen, are four switches stacked in a column (the activity bar). They choose what the left drawer shows: "Sprites", "Project folder", "Git history" or "AI agents". Above the sprite list are the "Search sprites", "Pin sprite list" and "Undock sprite list" buttons, and below it are "Backdrops" and the button for adding a sprite (Edit sprites and the backdrop, Manage projects with project folders and Git).
During long operations, the mouse pointer changes to a busy cursor.
Reorganized menu bar · Open the stage from the menu bar · Record button · Git button and left drawer
2.2 The TurboWarp Plus menu
Pressing the logo opens the "TurboWarp Plus project information" menu (the TurboWarp Plus menu in this guide). It collects TurboWarp's settings, the connection settings for GitHub and AI agents, and information about this editor.
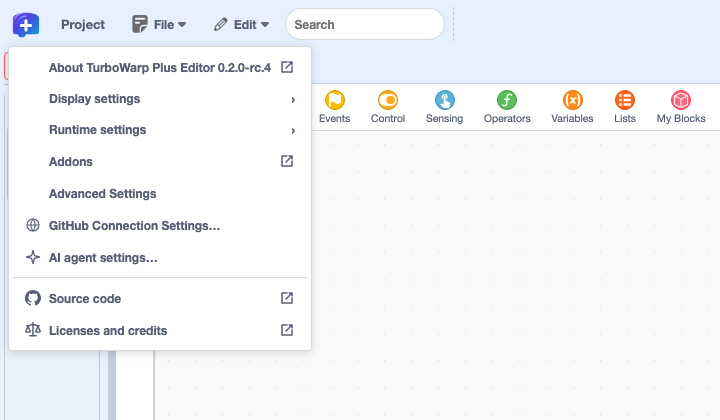
- About TurboWarp Plus Editor …: Opens the editor's version and build information.
- Display settings: Switches the theme, language and so on. Switching the language keeps the project you are editing and the extensions you have loaded.
- Runtime settings: Settings for how TurboWarp runs projects.
- Addons and Advanced Settings: Open TurboWarp's addons and advanced settings.
- GitHub Connection Settings…: On an editor with a GitHub connection, chooses the default way to connect to GitHub. The public editor (GitHub Pages) has no connection configured, so it shows "No GitHub connection is configured." (When there is no connection).
- AI agent settings…: Chooses which services (ChatGPT, Claude and others) appear in the "AI agents" menu at the left edge, and their URLs.
- Source code and Licenses and credits: Open the repository and the licenses of the bundled packages.
Items with a box-and-arrow icon at the right end open in a new tab.
TurboWarp Plus menu · Icon for items that open in a new tab · Keep the project when switching languages
2.4 The Edit menu and shortcuts
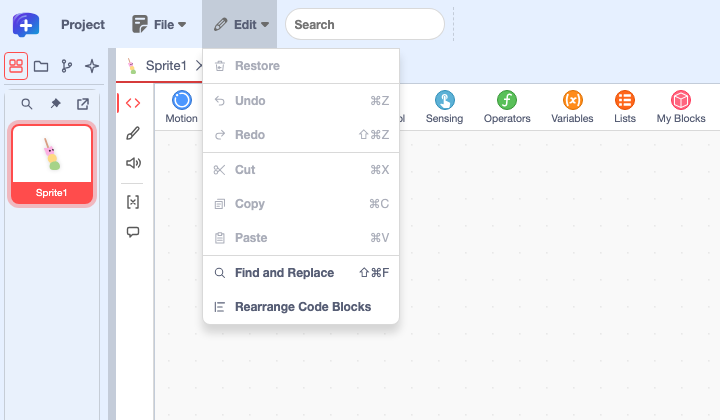
The "Edit" menu lists "Restore", "Undo", "Redo", "Cut", "Copy", "Paste", "Find and Replace" and "Rearrange Code Blocks". Each item shows an icon and its keyboard shortcut.
| Action | Windows and Linux | macOS |
|---|---|---|
| Undo | Ctrl+Z | ⌘Z |
| Redo | Ctrl+Y | ⇧⌘Z |
| Cut, copy and paste | Ctrl+X, C, V | ⌘X, C, V |
| Search the whole project | Ctrl+F | ⌘F |
| Find and replace | Ctrl+Shift+F | ⇧⌘F |
| Save (depending on what the left drawer shows) | Ctrl+S | ⌘S |
- "Undo" and "Redo" work on the history of the code view you are working in.
- "Cut" and "Copy" work on blocks selected in the code view. "Paste" can be chosen when there are copied blocks.
- "Find and Replace" opens the project-wide search panel. It is the same panel as the search field in the top row: if the search field contains text, the cursor moves to the "Replace with" field; if it is empty, the cursor moves to the search field.
- "Rearrange Code Blocks" opens a dialog that rearranges the scripts in the code view (Rearrange code and copy it to another sprite).
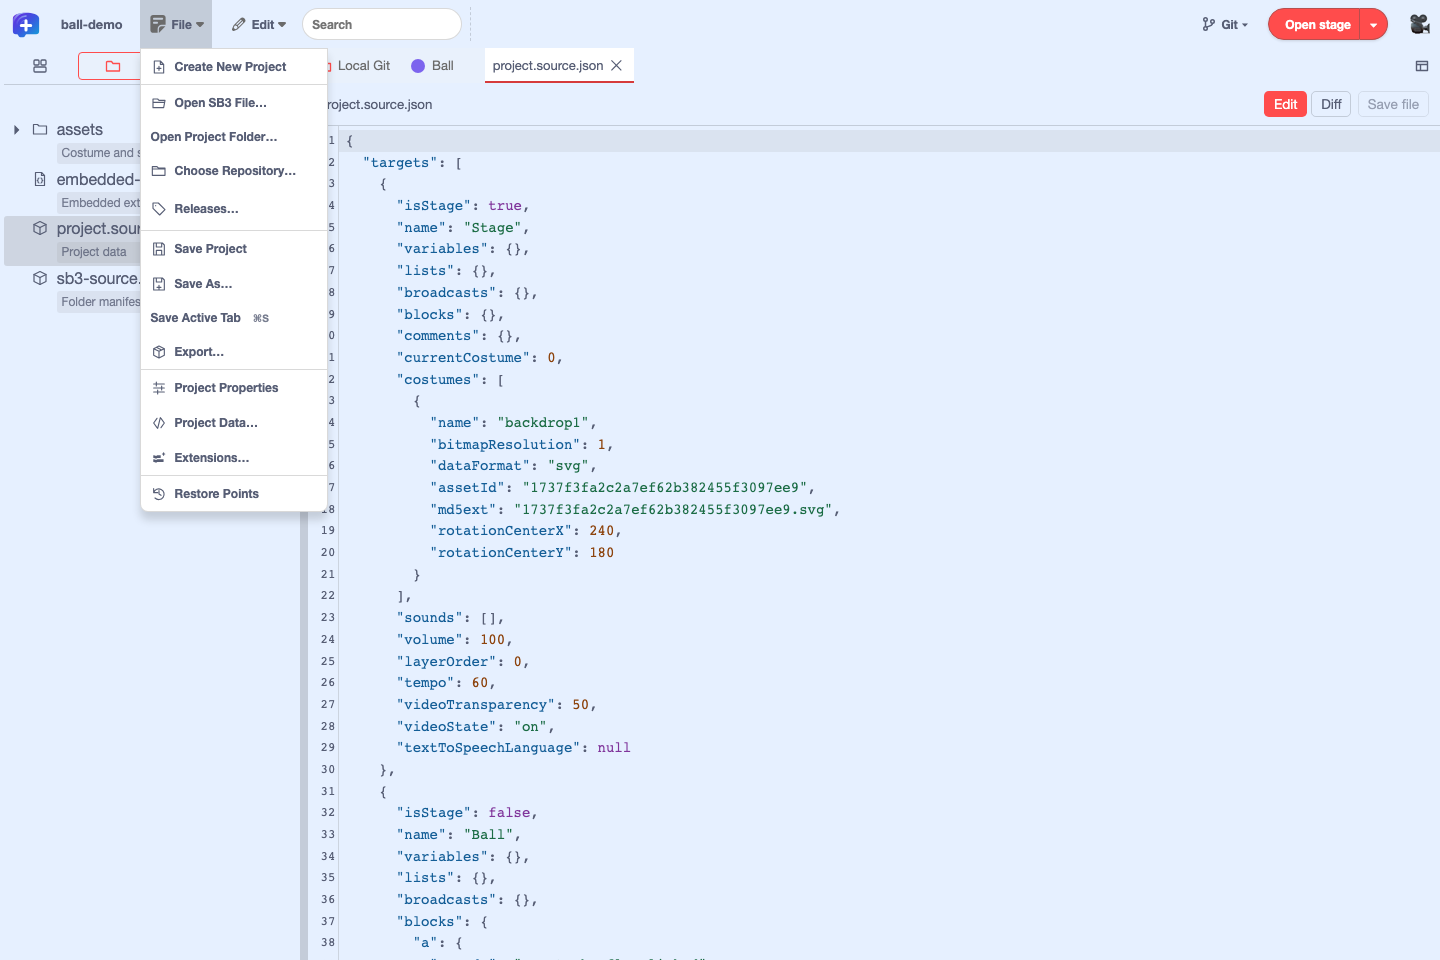
When the left drawer shows the sprite list, ⌘S (Ctrl+S on Windows) saves the whole project. When it shows the project folder, it saves the file in the active tab. You can see which one it is assigned to by checking which "File" menu item shows the shortcut (Choose between Save and Save as).
Edit menu · Icons and shortcut labels · Shortcut for find and replace
2.5 Extension buttons and the debugger at the top right
Control buttons provided by extensions, such as camera permission or Teachable Machine model settings, are gathered in the rounded box at the right end of the menu bar (the extension button area). A button appears only while its extension needs it, and disappears when the project is reloaded. Pressing it opens that extension's settings or controls.
- Buttons in the menu bar show only an icon. Check a button's name in the tooltip that appears when you hover over it.
- When TurboWarp's debugger is enabled, a "Debugger" button (shown as "…") appears between 🎥 (Record) and the extension button area. The debugger and record buttons are not part of the extension button area.
For example, the Kamishibai extension (Edit extension data and documents) shows a reload button for production work only while a YAML script is running.
Extension authors can register a button from an unsandboxed extension with Scratch.gui.stageControls.addButton.
Extension controls moved to the right end of the menu bar · Debugger position · Icon-only buttons · Specification for extension authors
2.6 Choose between the Plus layout and the Scratch layout
The Plus layout opens with the activity bar at the left edge and the sprite list pinned. You edit code and assets in the tabs in the middle, and use "Open stage" in the menu bar to open the stage in a separate window, a tab or the drawer (Open the stage and run your project).
To work in the classic Scratch layout, reopen the editor with twPlusStandardLayout=0 added to its URL. The stage and sprite list sit to the right of the code area, and the button for adding extensions appears at the bottom left.